Most of the art & science of product design comes down to decisions.
VEDAR is the simplest way to make good design decisions.
The quality of a product depends on many things, including how well you answer the following questions:
1. Which roadmap initiatives to tackle?
2. Which features to ideate, design, improve? What to do first?
3. Which design variations to choose?
4. How to develop design wisdom from previous design choices?
The most ill-defined skill in product design is how to make the best design decisions. You can’t do everything, so where do you focus? All decision shortcuts work some of the time, but blow up in your face when misapplied.
- Should we always do the easiest thing first?
- Should we do all the sales-requested features first?
- Should we do what users want first? What about what will help the business?
- Should we just do what our competitors or the latest trends do?
- Should we go after new markets or audiences with wild new features?
- Should we prioritize what the CEO or senior managers want?
- Should our team vote on the most popular or best looking designs?
- Should we “follow our gut” and “design intuition”?
Most of these approaches are partly right, part of the time, but disastrous if used all the time.
Why use VEDAR to Scale Decisions?
VEDAR is a really simple, standardized way to compare design choices that overcomes subjectivity and emotion. Just as the fidelity of your design should match the fidelity of your thinking, the scale of decision-making should match the scale of the issue. Whether you are deciding how the product should evolve over the next 3 years or how to prioritize a backlog, or choosing which variation for a single screen, VEDAR helps you:
- make faster, better decisions
- build a record of decisions that builds Design Wisdom
Great products are the result of many good decisions. Design wisdom accelerates your team’s ability to focus design and dev effort going forward.
What is VEDAR?
Nothing is more difficult,
and therefore more precious,
than to be able to decide.
VEDAR is a fast, visual, and bulletproof way to make any product or design decision. VEDAR is like RADAR, but for Value-based Design Decisions.
There are 5 simple steps:
- V is for Value.
- E is for Effort.
- D is for Dependencies.
- A is for Assign.
- R is for Ranking & Results.
If you don’t need more convincing, get the template here. Otherwise, read on for the play by play.
- Check out the free VEDAR Template, made with Figma & Figjam
I’ve simplified this for you by providing a template that you’re free to duplicate for your own projects!
V is for Value
How do you value each feature? For simplicity, let’s consider how features (new or changed) are evaluated.
The ingredients of feature value are:
- U is for User Value. 0-10
- For the users affected, how valuable is the feature to them? Why is it valuable? Does it save them time, money, confusion, or hassle?
- B is for Business Value. 0-10
- How valuable is the feature to the business? What does the business get from it? Does it help the business stay competitive, reduce support costs, gain more customers, make more money either directly or indirectly?
- R is for Reach. 0-100%
- What percentage of the user base will this feature affect? What’s more valuable? a) a feature that’s super-awesome for only 2% of your users or b) a feature that’s pretty valuable for 100% of your users? Reality is rarely this black and white.

Value = RUB (reach x user & business value)
Combine these numbers to estimate of the value of each feature. As shown above, just eyeball it for most decisions, but dig a bit deeper for big ones.
For big initiatives or features that take a lot of time, it’s worth considering how you weigh user vs business value. Serving only user needs or only business value is short sighted. Decide how you want to weight user/business value and apply consistently. Combining user and business value is like a fuel mixture, so I call it Octane %. High Octane is more focused on user needs than business, but features that have no business value or no user value should be dropped. The template lets you simply visually eyeball it most of the time, but it has instructions in case you want to calculate it.
Reach. What percentage of the user base will this feature affect? A 7 out of 10 feature is only an 7 if it affects 100% of the users, but it will become 0.7 if it only affects 10% of the users.
A quick estimate is fine for small stuff, but the provided template guides you to collaborate with the right people for big features to set user value (users+support), business value (product+mgmt), reach (product+mgmt+engineering) and then combine them to get a 0-10 value number.
E is for Effort
For each feature, get estimates for the level of effort (LOE) to design and build it. Many things are harder to build than design, but some things are harder to design than to build. Collaborate with the Engineering and Design Teams to figure out how much effort each feature will take to end up with a 0-10 LOE effort number.

D is for Dependencies
If it’s a small feature or just a few screens, skip dependencies. However, when meeting with the engineering team for big features, ask them about common dependencies. A dependency is unsexy back-end work, like an extension to an API, that might enable a bunch of new features to be easily built. For each feature in your list:
- Does it need new code modules written, or extensions to APIs? Record a list of all dependencies.
- Collect the common dependencies. Are there multiple features that need the same engineering work to support it? Dependencies aren’t sexy, but common dependencies are easier to justify doing.
- Adjust all your Effort values based on dependencies. Once the dependencies are built, a whole bunch of features may become a lot easier.

A is for Assign
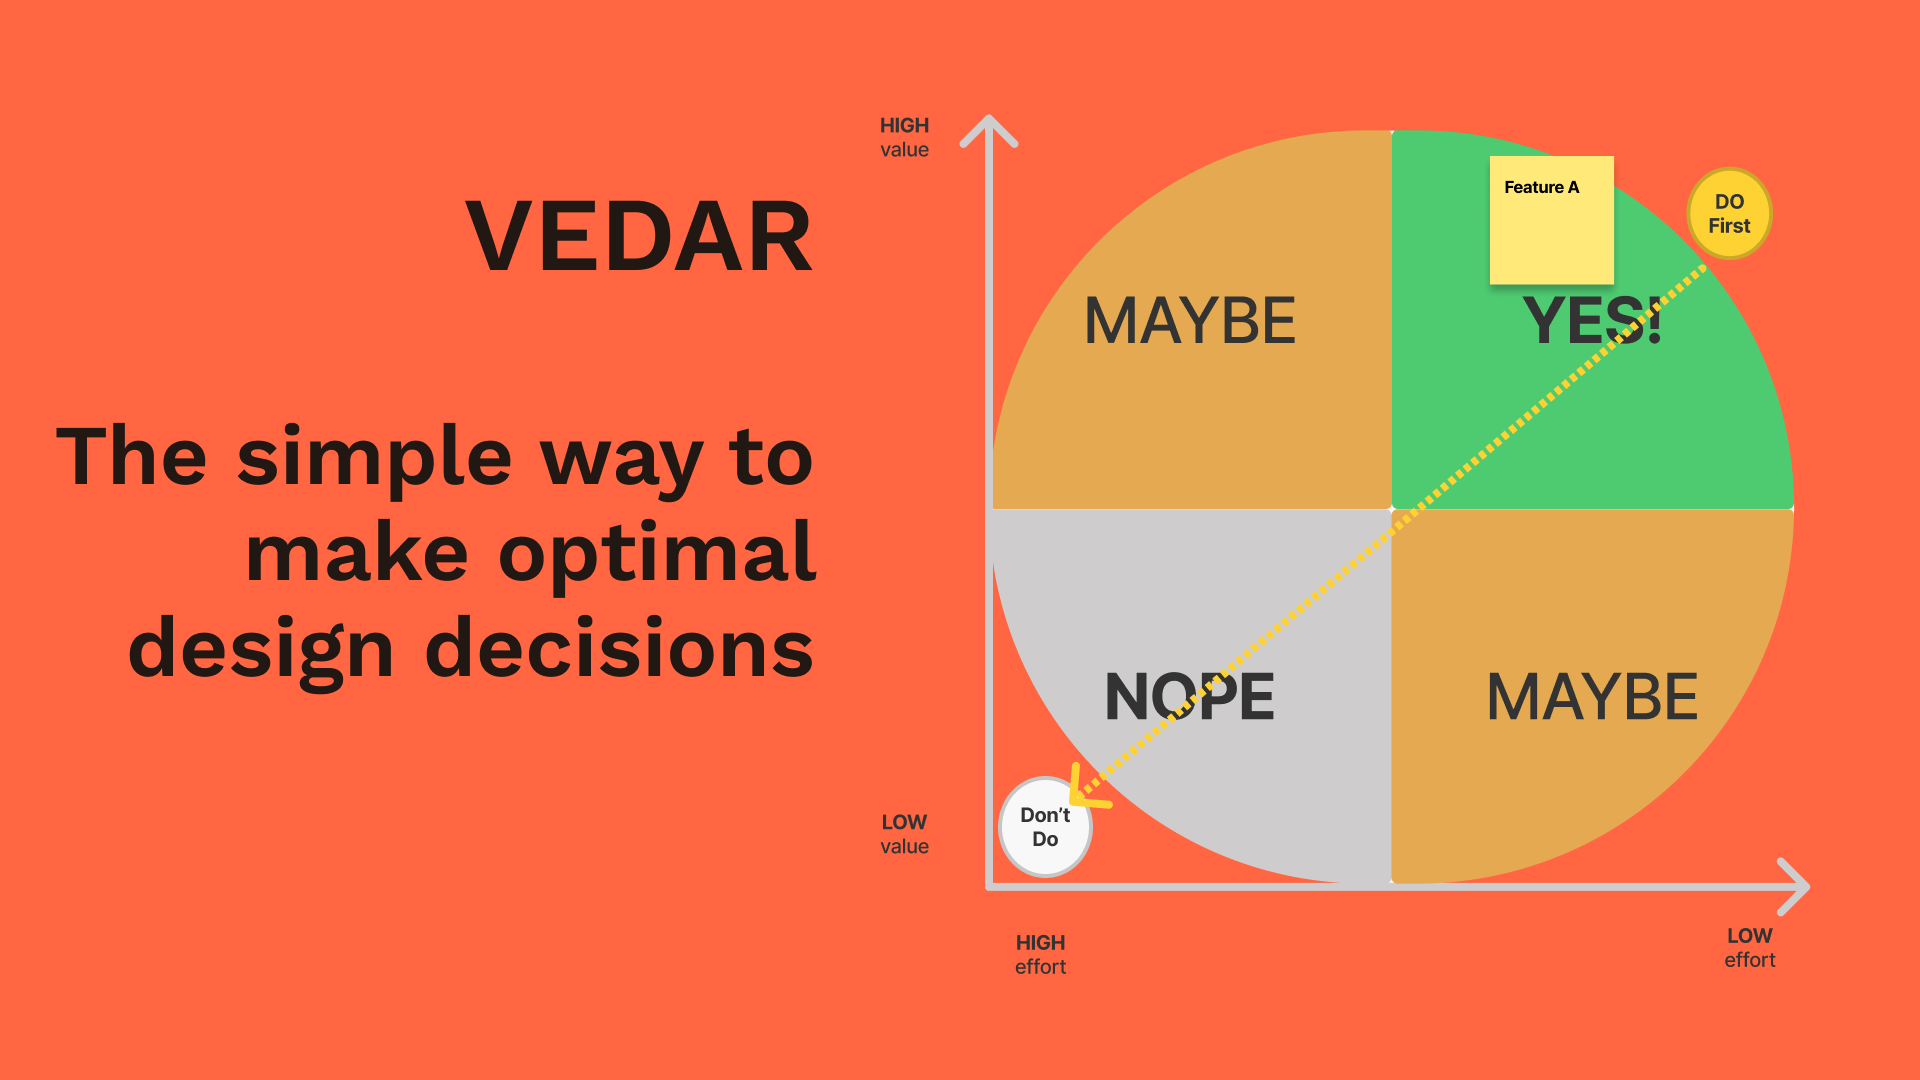
Okay, now that each feature has its value, effort, and dependencies determined, it’s time to Assign the features (and dependencies) a position on the decision graph. As you can see below, the chart is organized bottom to top with low to high value and left to right with low to high effort. Place each feature on the chart and proceed to the next step.

R is for Rank
You’re practically done! Apply the design decision overlay to the chart. Features in the upper right quadrant are YESs. Definitely do any YESs. The lower left quadrant is for HARD NOs. Don’t do NOs. Everything else is a MAYBE. Simple, right? However, there’s one final step.
R is also for Results
The design decision graph does more than break down features into YESs, MAYBEs, and NOs. It also gives you an effortless way to prioritize what gets done first to order and plan your work.
Do the YESs and MAYBEs based on their proximity to the upper right. The closer a feature is to the upper right, the more value you’ll get for the effort. It’s that simple. Order the list into a work plan.
Develop Design Wisdom
Do one simple thing to get even more value from VEDAR: don’t throw away your work. In most organizations, a lot goes into design decisions and then it’s tossed to the wind. Why did we do this instead of that? Why is the product the way it is? Why didn’t we do things that seem to make sense? It’s nice to refer to the record when making new decisions or onboarding new people. Don’t count on humans to stay forever AND remember the reasoning for every last thing. It’s worse than reinventing the wheel to keep reinventing the same decisions over and over again.
VEDAR’s simple, but complete, record of decisions creates a Design Wisdom record that will accelerate assessing, accepting or rejecting new ideas as the product evolves. It also makes it quicker and easier to onboard new product, design and engineering team members record can help you develop design wisdom so that a) you make better design decisions b) the whole team knows why products are the way they are c) the team knows why some features were NOT done d) what conditions led to all those decisions and e) you prevent the team from clobbering core, valuable features when adding new stuff to the product.

Scaling VEDAR from Tiny to Huge Decisions
Here’s my recommendation for scaling VEDAR from small to huge items:
- XS – Design Variations
- When evaluating variations on single screens or small flows, you can eyeball value, effort and reach quickly with minimal collaboration. To choose among 4 design variations were made for a screen, a) estimate the value, effort, and reach of each variation and b) place a sticky for each variation on the VEDAR final decision graph. The variation closest to the upper right is the winner. It’s that simple as long and the value/effort/reach estimates are realistic.
- The point is that VEDAR gives you a way to compare the objective merits of each option without making it a subjective (and invalid) popularity contest.
- S – Quick Wins
- Just like above, create the VEDAR post-its and follow the VEDAR visual process, but you just need quorum with the PM, Design and Eng leads. The template can let you sort out 8-12 Quick Win features in a single meeting. Make sure bigger things don’t sneak in without proper consideration.
- M – Mid-sized Features or Changes
- You need all the collaboration meetings to set value, effort, reach and maybe dependencies, plus some concrete design and dev details to move forward. Get real user feedback and feedback from the engineers and designers who’ll have to do the work.
- L – Large Roadmap Initiatives
- If you’re considering really big ideas such as entering new markets or new audiences, you need everything for mid-sized features, plus more. You don’t need the concrete details, but probably more cross-functional input from customer support, sales, operations, marketing. It’s tough to estimate such big items, so multiple rounds are usually called for. Remind everyone that the value/effort estimates need to be valid enough to make decisions, but no further. There’s only so much certainly you can get until you do a thing and see.
Duplicate the Free VEDAR Template
- Check out the free VEDAR Template, made with Figma & Figjam
Feel free to duplicate the template to use for your own projects! - https://www.figma.com/community/file/990642230890293264/VEDAR—Simplest-way-to-make-optimal-design-decisions
What’s in the template?
- Overview. Skim the Overview on the left.
- Steps Explained. Read the detailed instructions, just for clarity
- Example. A real world example that shows how a Casual Dating company could use VEDAR to plan & rank 5 new features.
- VEDAR Blank Worksheet. If you duplicated the file, you can add your own features and use VEDAR to help you make better decisions.
Here’s my small ask. If you enjoyed this article, share it with others!
Contact me if you need a great Product Design Director
Also published on Medium.